Live Chat is starting to change the face of business.
There have been recent studies conducted on Live Chat to determine the effect that it is having on online businesses and customer satisfaction.

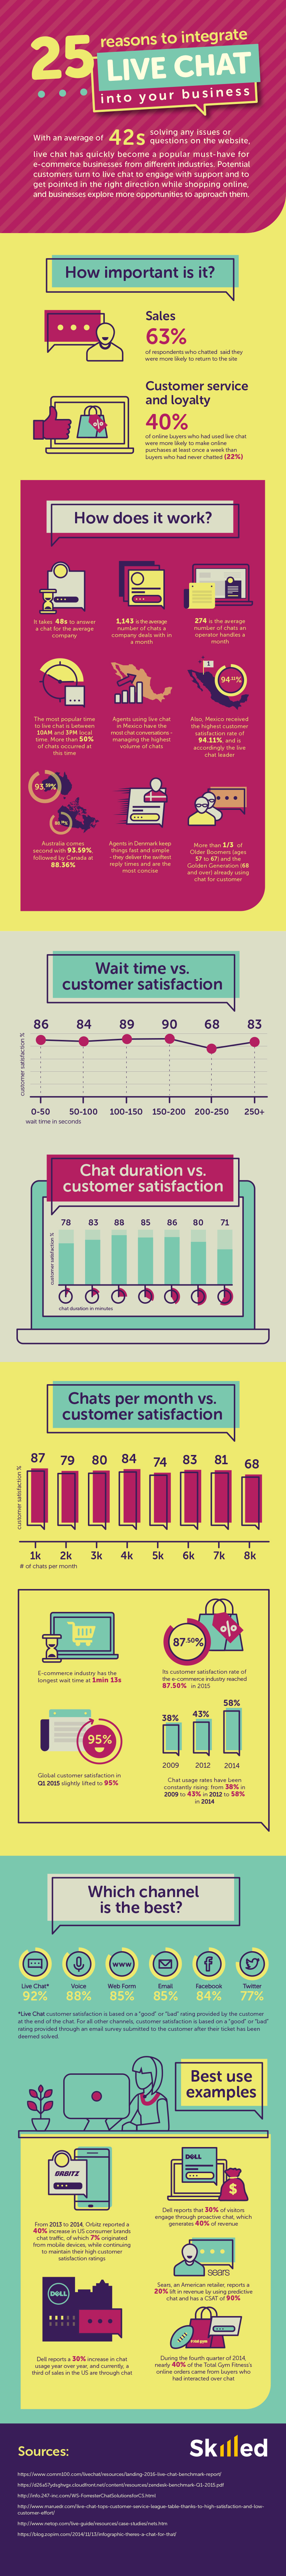
The results indicated that Live Chat is generally preferred by the majority of customers. It was reported that 92% of customers expressly stated that they preferred Live Chat over other channels of support. It is important to note that other channels of support received high rankings as well. Other popular methods of customer support were phone support with an 88% ranking, Facebook with 84% and Twitter with 77%. These statistics were determined from customer rankings after they received support on the different support channels.
In 2009 the usage of live chat was rated at 38%. By 2012, the rates had gone up to 43% and by 2014, the usage rates of live chats were at 58%. This pattern indicates that more people have opted to use live chat as the main option to get customer support. Live chat has a waiting time, just like the other channels of communication in customer support. However, with live chat it takes approximately 48 seconds for a Live Chat agent to respond to a customer’s query. The longest wait time for live chat in the ecommerce industry is approximately 1 minute and 13 seconds.
One assumption that is often made is that technological developments are made for younger generations. Recent studies conducted on Live Chat have reported that approximately ⅓ of the baby boomers and the golden generation are already engaging in Live Chat. Older boomers are people who are aged between 57 to 67 years old and the golden generation are people who are over 67 years. This means that Live Chat is used by 30% of senior citizens. This insinuates that Live Chat has been designed to suit the needs of all generations.
The country with the highest Live Chat usage is Mexico and It is interesting to note that Mexico also has the highest rate of customer satisfaction rate with 94.11%. This indicates that Live Chat is an effective way of offering customer support. Australia and Canada come in second and third with high customer satisfaction rates, with 93.59% and 88.36% respectively.
The country with the recorded fastest response rate for Live Chat is Denmark. Their responses are personalised, simple and concise. The average response time for companies in general around the world is approximately 48 seconds. An average company can manage up to 1,143 chats per month. For individual agents, it has been recorded that the average number of chats per month is 274.
The adjoining infographic illustrates 4 examples of businesses where Live Chat has increased their customer satisfaction and traffic. One of these businesses is Orbitz. Orbitz reported a 40% increase in consumer chat traffic for the US consumer brands between 2013 and 2014. It was recorded that 7% of the chat traffic was generated from mobile devices. There were high customer satisfaction ratings maintained.
In the last quarter of 2014, it was recorded that 40% of all orders that Total Gym Fitness received were from buyers who had engaged with Live Chat agents. According to the reports from Dell US, there has been a steady increase of 30% in Live Chat usage annually. This has a significant impact on Dell’s revenue considering that ⅓ of their total sales have been generated through Live Chat.
Customer service is a process that lays the foundation for all businesses. An online presence is a critical element and Live Chat can provide high quality online support for customers. To discover more about Live Chat, take a look at the infographic below to discover all there is to know about Live Chat.

Colin Cieloha
Colin Cieloha is an American author and content marketer at Skilled.co. He writes about everything that will draw his attention with a focus on the mobile and e-commerce space. When he is not writing he is spending his time traveling the globe and snowboarding.